
QSAS: A Science Analysis System for Space Plasma Data
Data Selection
The QSAS Data Selection window allows data to be organised into databases. The window presents a hierarchical view of this data, enabling the user to determine the data availability simultaneously from several sources and perform data retrieval for selected time intervals without any knowledge of file locations or names.
Each database comprises a list of folders (and their subfolders) of data, and the same folders can appear in multiple databases to allow different views of the same data holdings. For each folder in a database a binary map file (.xxx.map) is created holding the names of the variables, their intervals of availability and the corresponding data file names. If the user has write permission into the data folder the map is stored with the data (as .qsas.map) to be available to other database views, otherwise a map file is created alongside the database (yyy.qdb) file.
Choosing Data Selector from the File menu of the QSAS Main Window brings up the Data Selection window.
Selecting Open Database from the Database menu will produce a file selection dialog for opening a database (yyy.qdb) file. This will be an ASCII file which has been previously produced using the Create Database menu item. Multiple databases may be open at once, and the Close Database option in the Database menu will close the database associated with any selected folder in the Database Listview.
Selecting the Create Database menu item will show a file selection dialog to choose the top level data folder of a data hierarchy to place in the database. Note that other folders may be added to this database later (see Database Manager below). All data files that are understood by QSAS in the selected folder and hierarchically in all sub-folders will be opened and mapped. When this is complete another window will request a name for the new database. This will be the name used for the database (.qdb) file and also the root item in the Database Listview. Further management of this database is then through the Database Manager.
All operations that may be time consuming will activate the interrupt button and progress bar. An interrupt will be applied at the end of a file operation, so interrupts are more responsive if the data are in smaller files. As a general rule, reading CEF files is an order of magnitude slower than CDF files, and a more responsive system will result for data in this latter format.
Note that the Data Selector is agnostic in terms of the data file formats, so that a single folder may contain data in any format understood by QSAS for the same data products, and continuous data will be ingested for the selected time interval irrespective of the file formats encountered. However, the disadvantage of this is that if the same data interval is held in two formats the data is duplicated in the final object on the Working List since the merge operation of importing across multiple files interlaces data according to the time tags. This can make ingestion unnecessarily slow and care should be taken in managing data folders to avoid this.
The window comprises four main components:-
Each of these individual components is described in more detail below. As a first experiment it may be helpful to try creating a database of the Sample Cluster Data shipped with QSAS, and such a database will be used in the following examples.
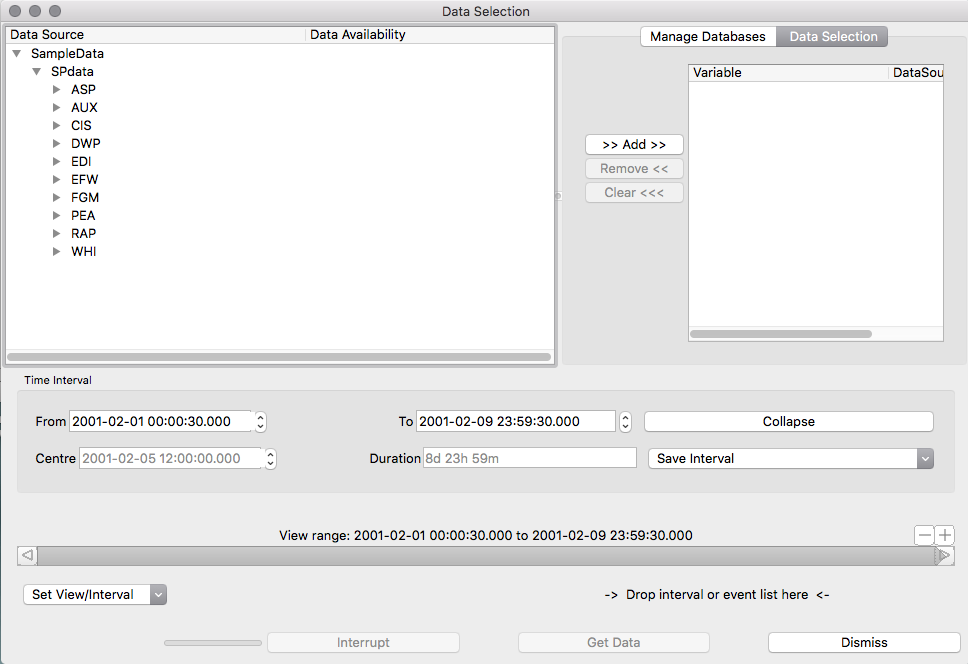
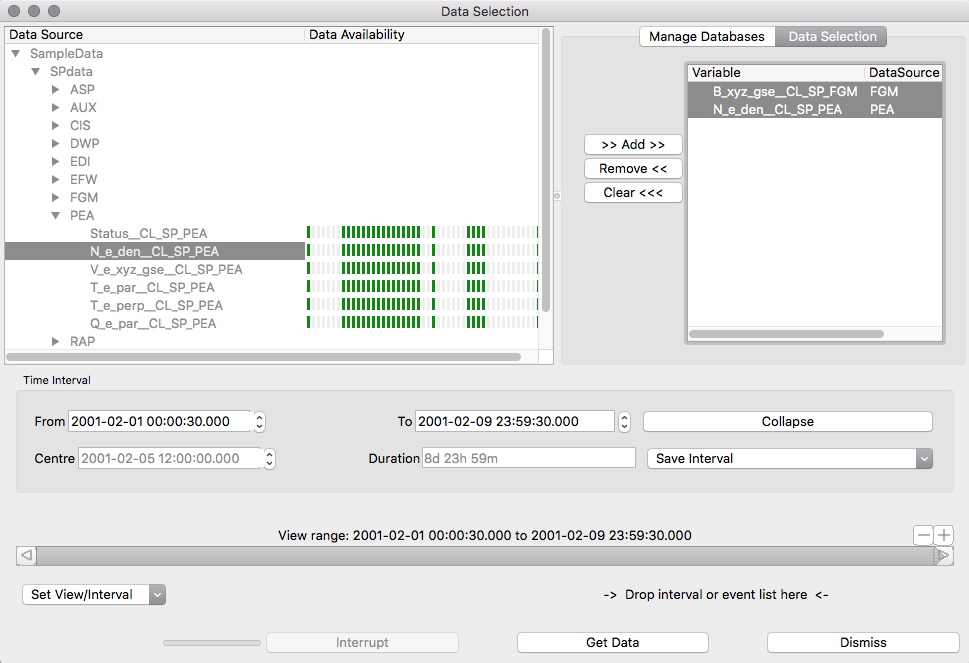
Once the database has been opened, a hierarchical list view of the data folders will be shown in the Database listview as in the above screen shot. Opening a folder will show the data availability over the selected time range for each variable in the folder (see screen shot below).
The data availability for a particular data source, is displayed as a single row of cells. The number of cells is determined by the width of the Database Listview window. Thus, the period of time represented by one cell is dependent on the number of cells shown and the currently selected time interval. One can change the resolution by simply editing the time interval selected in the Time Interval Editor and, to a lesser extent, by resizing the window.
The cells are highlighted green when some data is available in the interval covered by the cell and the grey when no data exists in that interval. Each interval of data in the map is considered continuous if it has no gap greater than 5% of the time interval covered by the file. Thus storing data in small files will result in larger data maps, but a finer view of actual data availability, and faster access to short data intervals.
Double clicking on a variable will copy it to the Data Selection list ready for ingesting. This is equivalent to selecting and item in the Database Listview and pressing “>> Add >>”.
Right-clicking on any data source item in the Database Listview will produce a sub-menu with options:
Selected variables appear in the Data Selection list, displayed on the right-hand side of the screen. There are three pushbuttons to the left of the Data Selection list :-
>> Add >> copies a selected item from the Database Listview to the Data Selection list.
Remove << deletes a selected item from the Data Selection list.
Clear << deletes all items from the Data Selection list.
Right-clicking on any variable in the Data Selection list will produce a sub-menu of options :-
The Get Data button at the bottom of the window will retrieve the data for all the variables in the Data Selection list (together with the associated timetags for the selected time interval, and all associated metadata) and place each of them as an object on the Working List. The Window remains open for further data selection from the same database and must be dismissed manually. The same selection may then be fetched for a different time interval. Each time Get Data is selected all variables in the Data Selection list will be imported, even if they have been fetched before. While data import is happening the interrupt button is active, and a progress bar is shown. Interrupt is done at file level, so interrupts are more responsive if data is stored in smaller files.
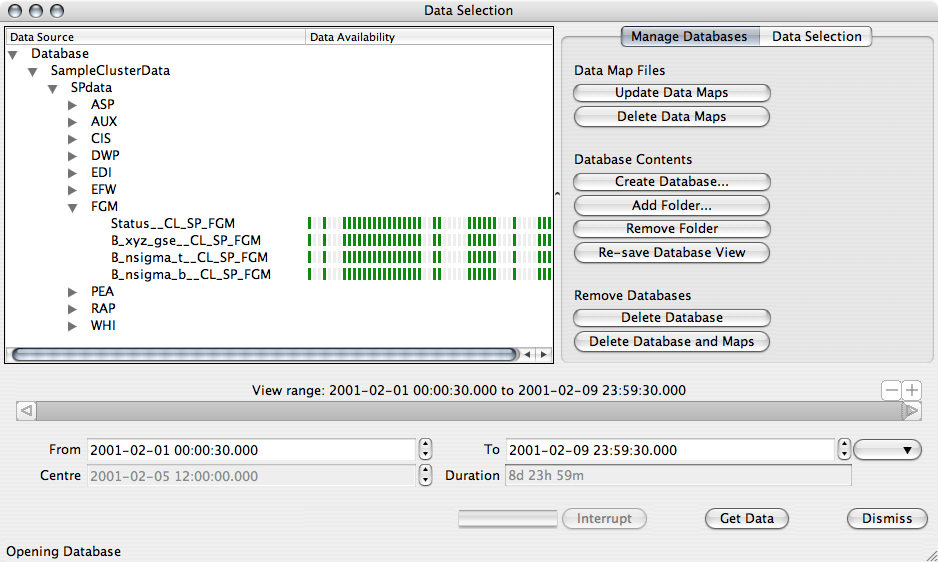
Selecting the Database Manager tab replaces the Selection List with a list of buttons for managing databases and their associated data maps.
The top two buttons affect only the binary data map (.map) files associated with selected folders.
The centre four buttons operate on the database and its representation in the Database Listview. A database is selected if any of its folders is selected.
The bottom two buttons allow deletion of a selected database. A database is selected if any of its folders is selected.
The Time Interval Editor shows the time interval that is used for displaying data availability and data retrieval. The same time interval editor is now used across QSAS. Using the collapse button it is possible to show just the minimal interval editor of start and stop date/time or an expanded editor which also shows a centre and duration field or the full editor that also shows an outer viewport of the full interval available (shown above).
The time interval displayed will default to the period covered by the open databases. When first opened the viewport and interval are both set to the full range of the data covered by the open databases. Changing the selected interval will update the data availability shown in the Database Listview as well as showing the selection as a grey interval within the viewport bar. This permits the user to change the selection interval without losing visibility of the time range covered by the database.
The viewport bar is normally titled by the full viewport range, but placing the cursor over the bar will display the current time position.
Time intervals can be edited by modifying any of the time fields, and the last two selected fields will be active. The interval may also be changed by dragging the grey interval within the viewport bar, or by dragging either end of the interval.
The time interval editor accepts event sequences (sequences of time intervals) and these permit faster retrieval of data for pre-selected events. The time interval (end event) editor is explained more fully elsewhere.
Page created by Tony Allen, csc-support-dl@imperial.ac.uk
Last up-dated: October 2016