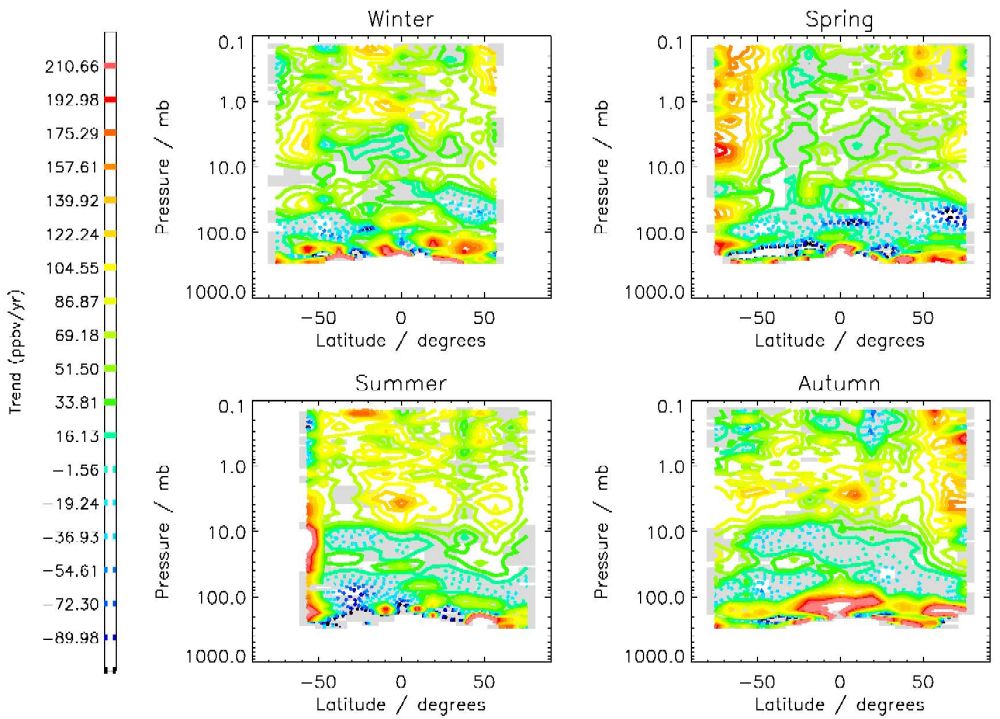
The figure shows seasonal trends in water vapour derived from HALOE version 19 data. The data is plotted as a function of latitude (horizontal axes) and height, scaled as pressure, (vertical axes). The trends are colour coded as shown on the scale to the left of the figure, with solid lines denoting positive trends and dotted lines denoting negative trends. The shaded regions indicate insignificant trends at the 95% confidence level.
Return to main SPAT News page.