Oceanic impact on midlatitude climate variability
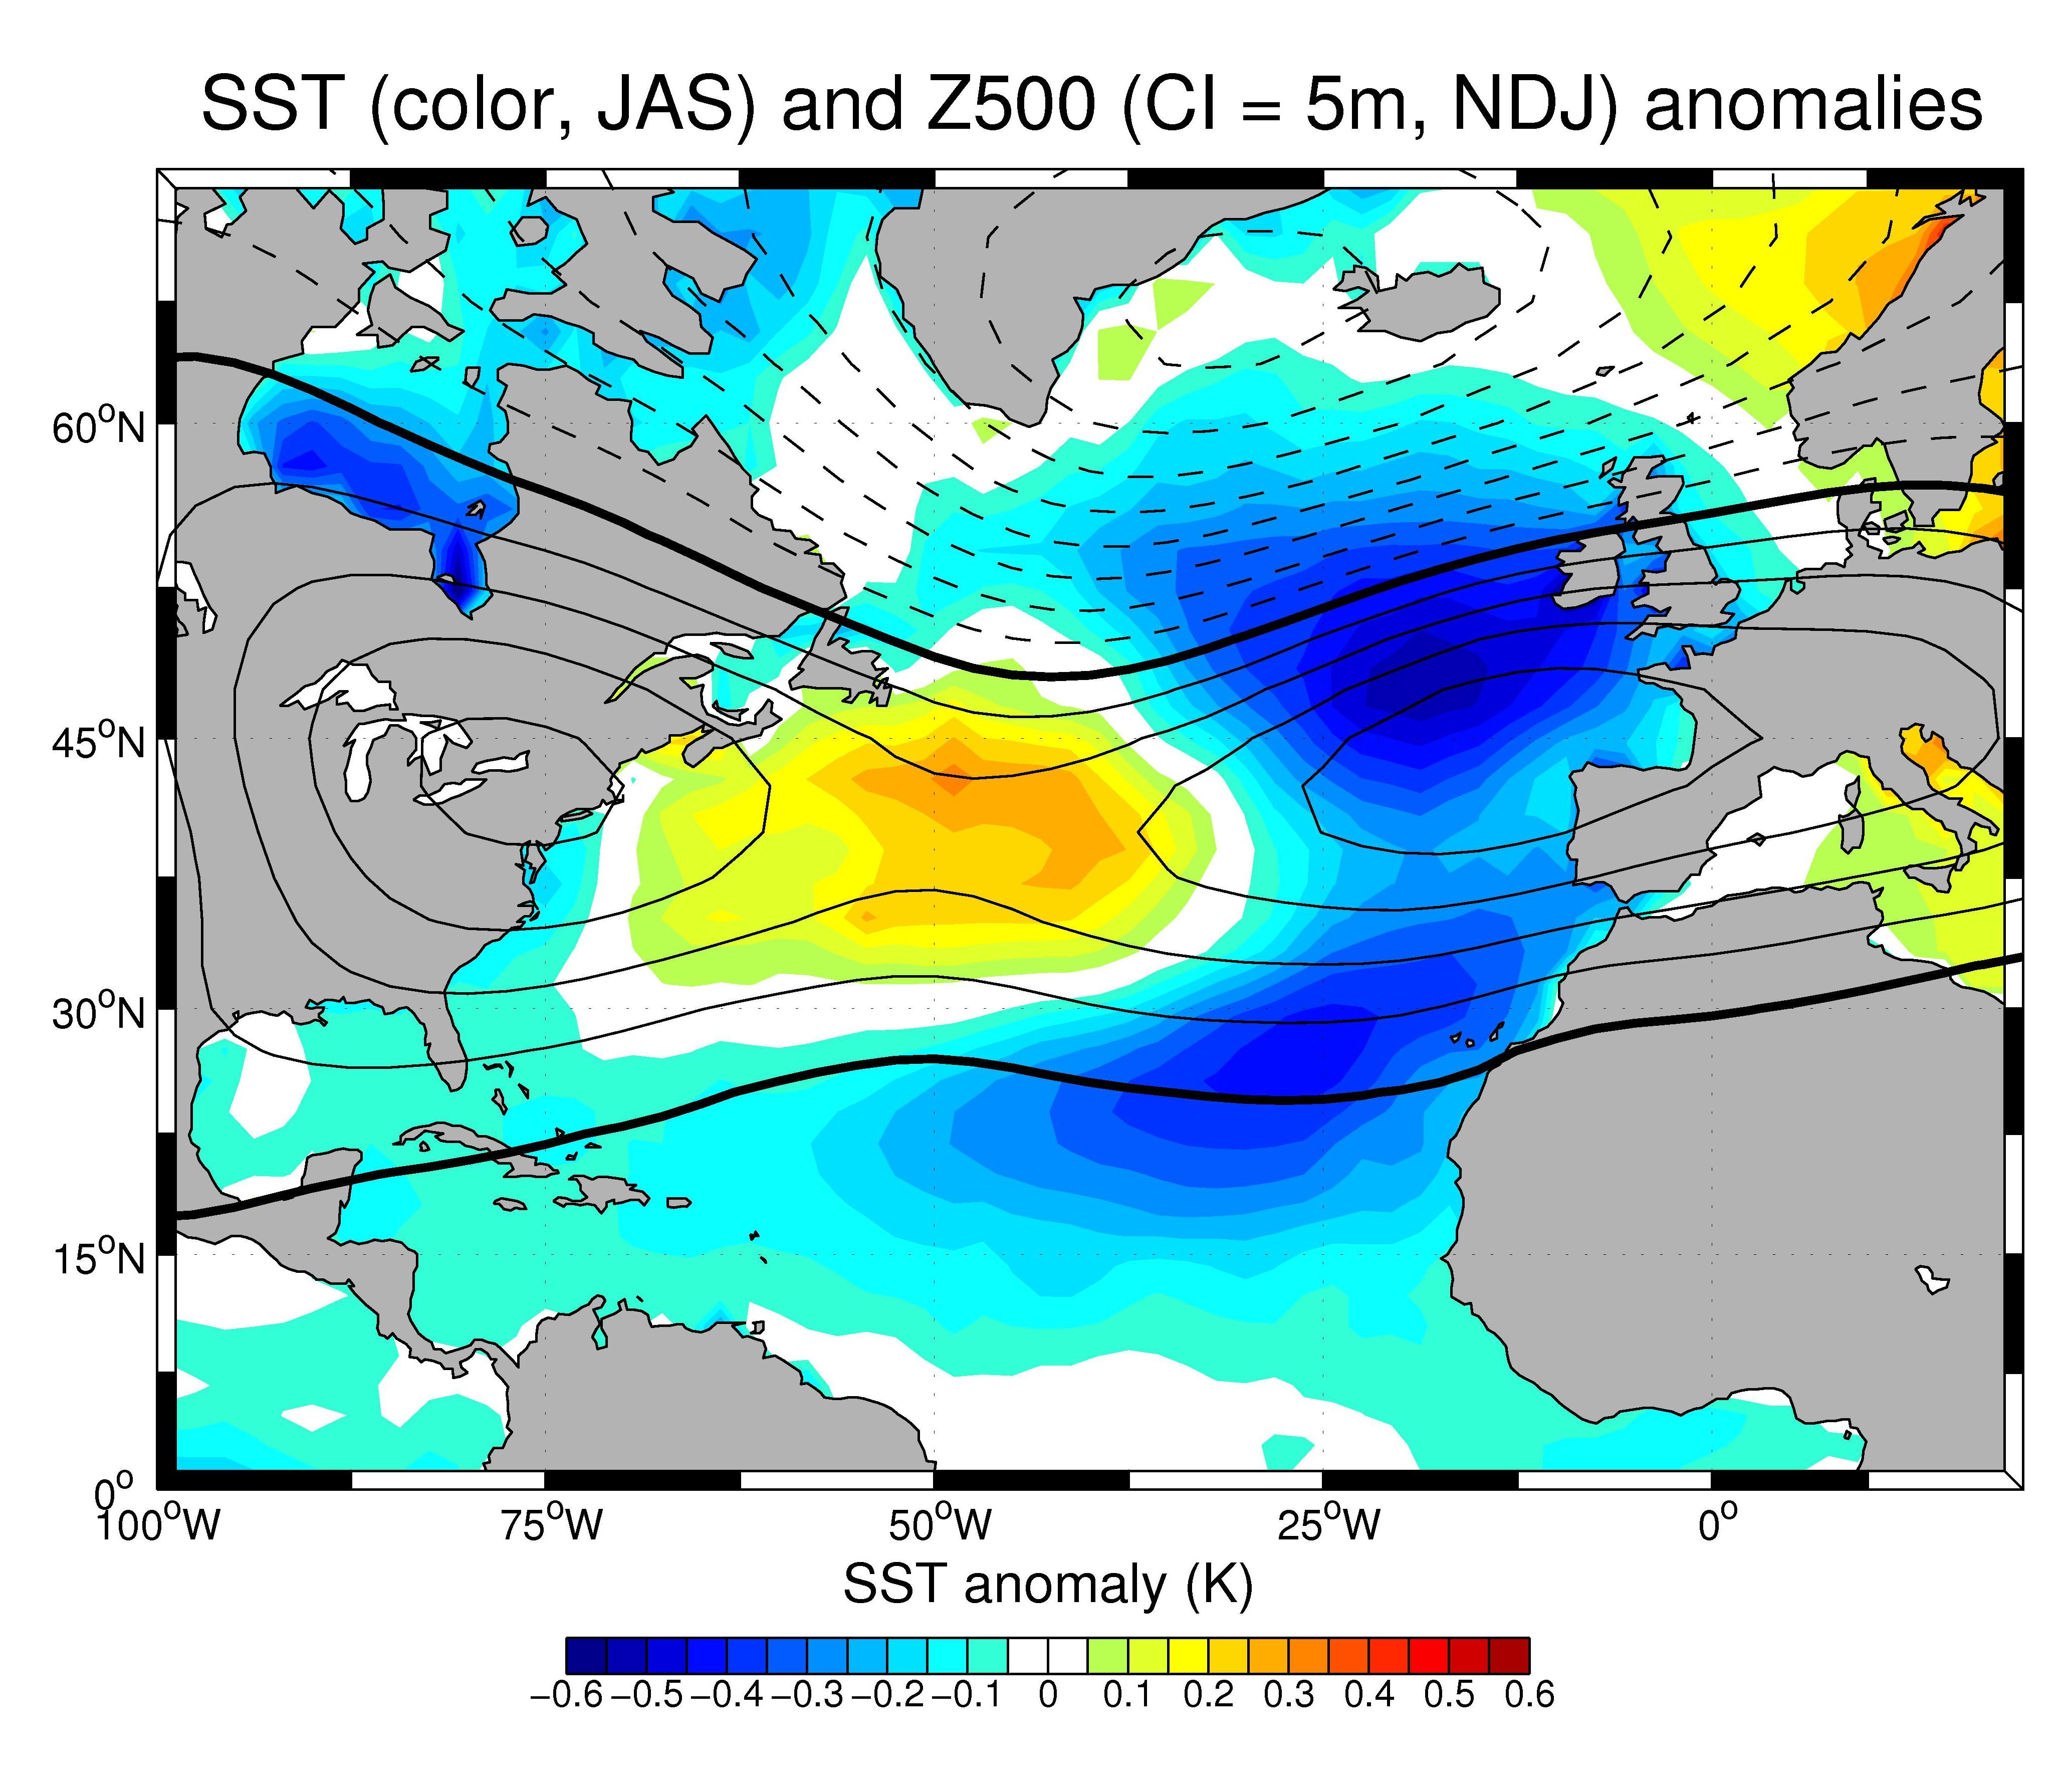
Do sea surface temperature (SST) anomalies over the North Atlantic Ocean help predicting the weather over Northern Europe? Figure 1 below, suggests, for the first time using observations, that this is indeed the case. The color plot represents the SST anomaly in late Summer, with warmer waters when red and colder waters when blue. The contours indicate atmospheric pressure anomalies at 5km height 4 months later. The changes in atmospheric pressure which lag by a few months the changes in oceanic conditions are important: they represent the so-called "North Atlantic Oscillation", the dominant mode of variability of the Jet Stream over the Northern Hemisphere. About 20% of the variability of the North Atlantic Oscillation can be attributed to the oceanic forcing. Click here to know more about this.
Figure 1
Coupling of oceanic and atmospheric heat transport
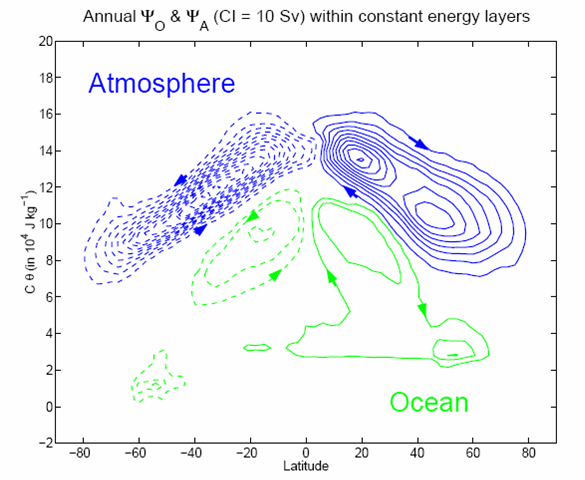
Who of the ocean and the atmosphere dominates the Earth's transport of energy from warm equatorial regions to cold polar latitudes? Despite being such a simple question, there is to date no simple answer to it. Figure 2 below, however, obtained from analysis of atmospheric observations and an oceanic general circulation model, is providing keys to solve this climate mystery. Ocean (green) & Atmosphere (blue) carry energy across a latitude circle (x-axis) by exporting high energy fluid poleward and low energy fluid equatorward. This is seen in the picture in that the poleward flowing branch of the cells are at a higher energy level (y-axis) than that flowing equatorward. Oceanic & atmospheric cells have a comparable "thickness" in this plot, which indicates that the energy contrast between the poleward & equatorward branches is similar. The number of contours is however much larger for the atmospheric than the oceanic cells. This is reflecting that more mass is transported across latitudes in the atmosphere than in the ocean (larger north-south velocities in an atmospheric storm than in an oceanic current, this speed difference, and the larger horizontal extent of the storms, more than making up for the density difference between air and water). As a result, the atmosphere is the primary contributor to the planet's energy transport in midlatitudes. Click here to know more about this.
Figure 2
Frontal coupling
More recently we've been focusing on the coupling between oceanic and atmospheric fronts. This is a rich and largely unexplored area of air-sea interactions which brings together the whole dynamics of the motions and not just thermal interactions. An example of such mechanism is the anchoring of atmospheric mesoscale instabilities by the Gulf Stream (Fig. 3). Click here to know more about this.
Figure 3
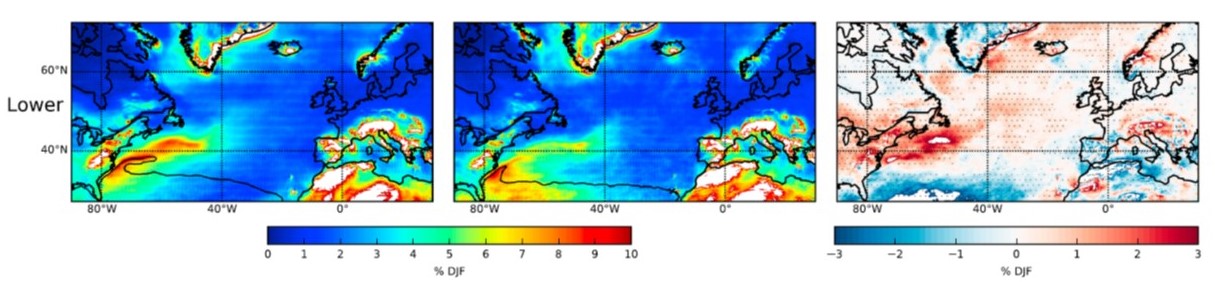
This figure shows the frequency of occurence of events with negative Ertel PV at low levels in the ERA5 dataset during the cold season. The panels on the left and in the middle display this quantity for different states of the Gulf Stream, as represented by the location of the 21 degree Celcius isotherm (black line). The panel on the far right shows the difference between the two states.
For more info:
Arnaud Czaja: a.czaja@imperial.ac.uk
Return to SPAT website.