Atmospheric Science with TAFTS
Cooling rate diagrams showing the importance of the Far IR in the
Earth's radiation budget
in cooling to space.
The diagram
below, taken from the PhD thesis of TAFTS student Neil Humpage
(Imperial College London 2010), shows cooling rates as a function of wavenumber
(cm-1) and pressure calculated for (a) a tropical atmosphere, and
(b) a sub-arctic winter atmosphere.
Calculations by Brindley and Harries (1998).Units are K day-1 (cm-1 )-1
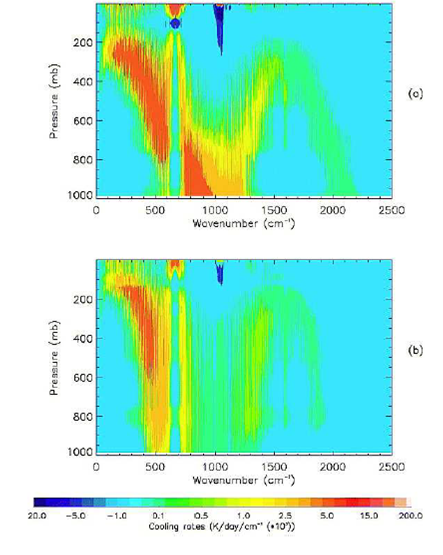
In the plots the red and orange areas show significant cooling of the atmosphere to space in the troposphere.
It is clear from the cooling rate diagrams above that the water vapour bands at longer wavelengths beyond 12μm (below 833 cm-1) have a strong effect on the Earth's radiation budget .
In both examples the cooling to space lies in the mid- to upper troposphere and the peak occurs in the far infrared. It is noticeable that in the tropical atmosphere there is also cooling to space from the lower troposphere in the mid IR, where the Earth's atmosphere has a mid IR window, and this is because of the weak water vapour lines and the water vapour continuum absorption and emission in this spectral region. There is far less cooling via this mid IR window seen in the sub-arctic winter atmosphere as it is much drier and so water vapour concentration is far lower, and also because the sub-arctic winter atmosphere is much colder in the lower troposphere by 40K compared to the tropical atmosphere.
The altitude at which cooling to space peaks for a particular wavelength in the far IR will depend on the opacity;if the atmosphere is less opaque (has less water vapour, is drier) then the lower altitude in the atmosphere it will be that peak cooling occurs. This is because the far IR radiation is able to travel further in the atmosphere without being absorbed by the water vapour present.
Back to Juliet Pickering homepage
Back to FTS Laboratory homepage